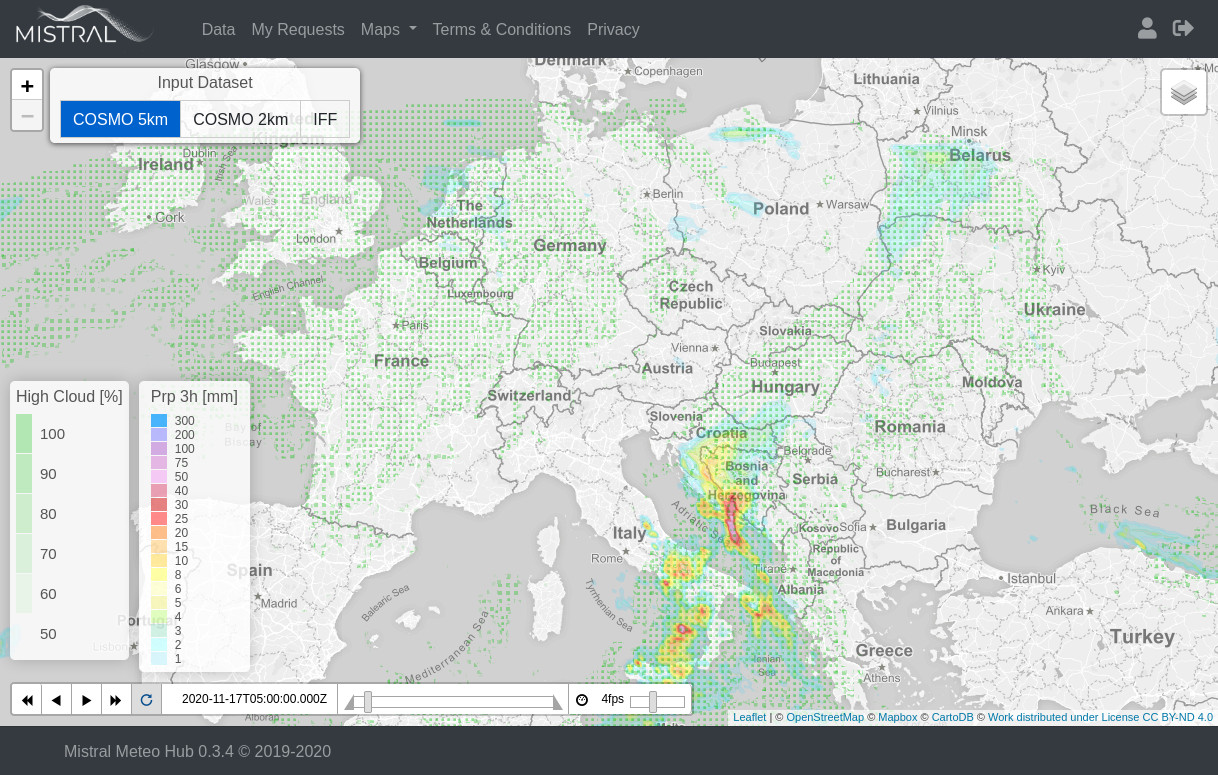
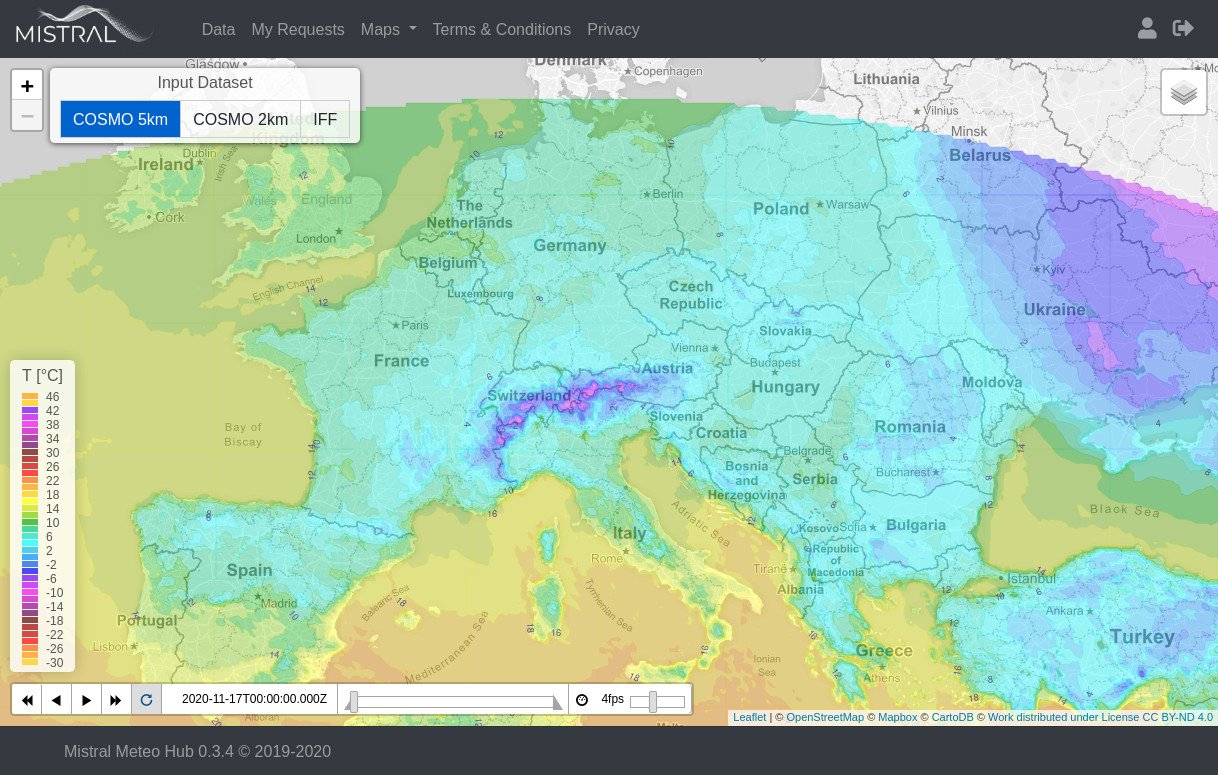
Meteo Tiles
In meteotiles each meteorological variable is represented as a web map side by side. This allows a dynamic visualization of the maps, allowing navigation and zooming, as well as the superimposition of multiple maps, each representing a different weather variable.
A tiled web map is a map displayed in a browser that is represented by seamlessly joining files of subpictures requested individually on the Internet. Not all tiles are required simultaneously; only those necessary to cover the area visible in the map viewer, in addition to the surrounding ones, are transferred from the server to the client and stored there in the cache.
This method is used because the map application becomes faster and the server is not busy due to sending bulk data to a few users.
Meteotiles represents a different types of data visualization through maps. While in forecast presentation a static map in .png format (not geo-referenced) is created for each meteorological variable, in meteotiles a set of geo-referenced tiles are created for each variable, to allows zooming and overlay.